
How to use Traceroute Command In Linux
Traceroute Command Linux: Hi, welcome back. Today I will be explaining a little about Traceroute and how we can use Traceroute to diagnose network connectivity problems. By using Traceroute we can also reveal what route packets have taken to reach their destination. Traceroute is a Networking diagnostic utility for displaying and also measuring the path traffic takes when it’s distributed across an internet protocol network. When your traffic is distributed it must first go through several intermediaries before reaching the destination. This destination can also be known as an endpoint – it is the last point that the traffic reaches. Let’s say for example that we’ve done a TraceRoute on a website. Traffic will go through your local router then to your internet service provider’s routers and then on to larger sets of networks and so forth. Each time the traffic takes a hop, delays will occur at each stop the network traffic takes. Traceroute then sends sequences of ICMP/UDP packets – this is the protocol that is also used by the ping command. The first ICMP/UDP packet has a TTL (time-to-live), this can also be known as a hop limit so, for example, let’s say the first packet has a TTL of 1, the second ICMP/UDP packet has a TTL of 2, and so forth. TTL is often set to 32 or 64 when packets are held by intermediate routers. Every time a packet is then passed along the network to a new router the TTL will decrease by 1. When TTL reaches 0 the packet will then be discarded by the network and an error would be returned by the router such as ICMP port unreachable or TCP reset. When we send packets this way it ensures that the routers will discard packets and send back a response to Traceroute.
The payload can also vary, as well as the source and its destination ports. Traceroute does this to avoid firewalls or discover the sizes of packets being dropped along the network path. The Internet Control Message Protocol (ICMP) has many messages that can be identified by a type. All versions of traceroute rely on ICMP type 11 (Time exceeded) responses from each hop along the route. If ICMP type 11 responses are being blocked by a firewall or IDS, they will not be able to function as they are inbound, not outbound. ICMP type 30 is used for traceroute and is as an “Information Request”. Traditional traceroute uses UDP to increment ports for every hop packets take. Traceroute is not limited to ICMP/UDP, it can also provide support for protocols such as TCP, SYN, etc. The default UDP port on UNIX-like implementation is from 33434 to 33534. ICMP implementations use an “echo request” (type 8).
ICMP type 0 “echo response” may come back as the very last packet this happens when the TTL equals exactly with the number of hops. Traceroute will know it has finished when it receives an ICMP type 0 response. ICMP type 0 are inbound packets.
TCP SYN packets will cause either a RST reset packet or a SYN ACK packet in response when they reach their destination. SYN and SYN-ACK packets handle a 3-way handshake (also called TCP-handshake). TCP (Transmission Control Protocol) three-way handshaking technique is often referred to as “SYN-SYN-ACK” or to be a little more accurate SYN, SYN-ACK, ACK. These handshakes are implemented so that both ends can use separate TCP socket connections at the same time in an orderly fashion without colliding with each other. For example, if you were to receive an SYN-ACK packet its good procedure to send back an RST (Reset Packet) – this helps stop half-open connections being left on the server.
It is also possible to receive ICMP type 3 code 4 responses back instead of ICMP type 11 responses when sending larger packets with the “Do not fragment” flag. However, Traceroute will often go with the smallest MTU (maximum transmission unit) to find the hop. MTU is the size of the largest network layer protocol that can be communicated with using only one single transaction.
If you’re running a traceroute on a website let’s say one hosted in a different part of the world or a region further away you will be able to see how the hops that the network traffic takes will differ. When packets are sent to a router this can be known as a hop – these are basically like check-in points for your traffic as it makes it journey to its end destination. The first line represents your home router (if you connecting through one). The next lines in the sequence then represent ISP and then each line further below represents a router or gateway that is further away.
The sequence and displayed Traceroute takes will go as follows.
Hop RTT1 RTT2 RTT3 Domain Name [IP Address]
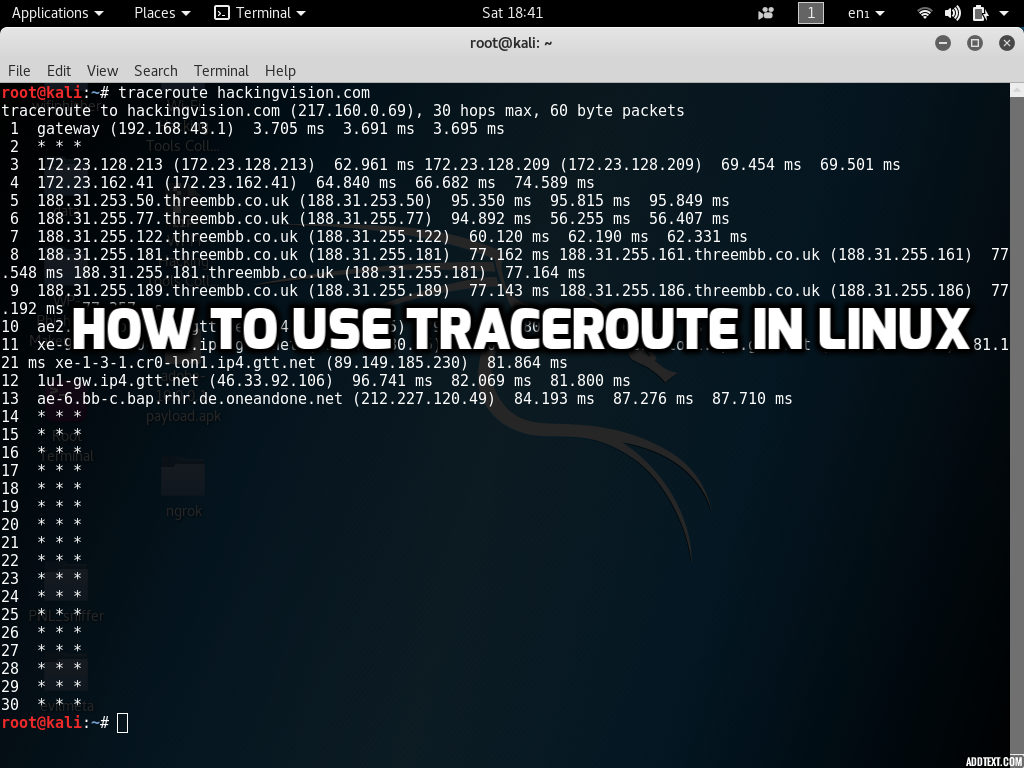
Whenever a packet is passed along the network between a router, this can also be referred to as a hop. The screenshot below shows that packets take 13 hops to reach the HackingVision web server.
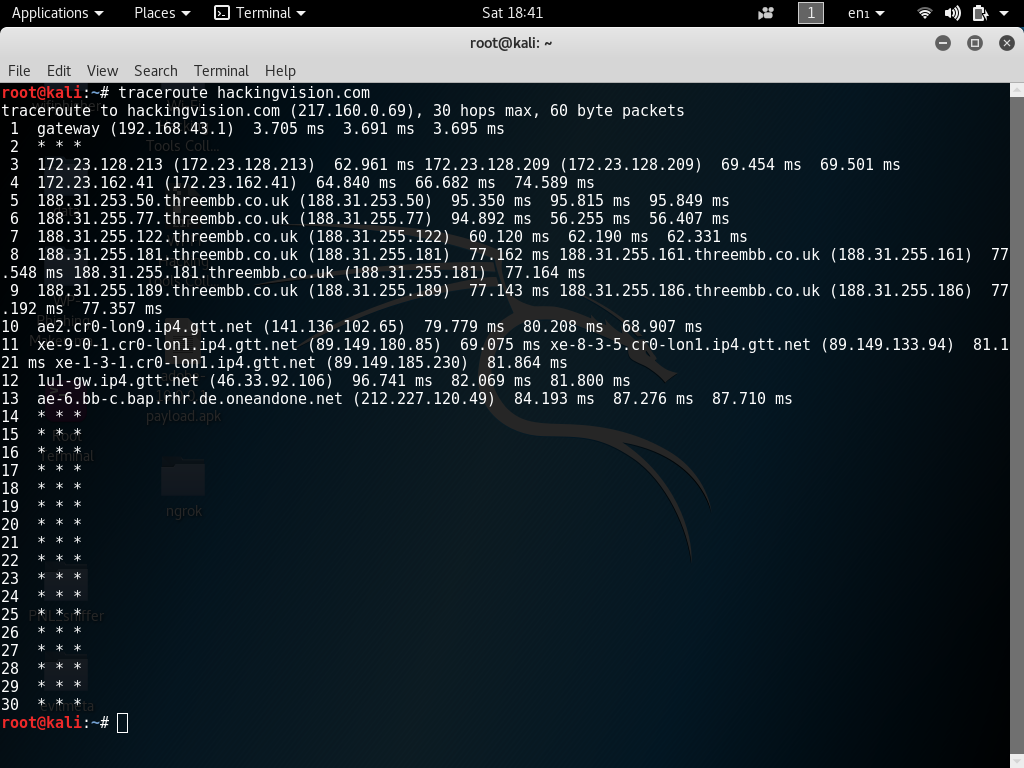
Round Trip Time also is known in short as RTT this is the time it takes for a packet to receive a hop and back to your computer or personal Internet device. Round Trip Time is recorded in milliseconds. RTT can also be referred to as latency. RTT1, RTT2, RTT3 represent the time that is taken to complete hops back to your computer. Three packets are sent by Traceroute for each hop taken. It will display each time a hop has been made, which will then give you an understanding of the latency if its consistent or inconsistent. If you receive back a * this indicates that there is packet loss somewhere along its journey.
When using Traceroute on various domain names or IP addresses, it can help find a location of the router because ISP’s usually assign domains related to location and ISP of their routers (e.g. IP.ISP.FQDN in 188.31.253.50.threembb.co.uk). If the domain name can’t be found then Traceroute will display only the IP address of the router. The default probe datagram length is 40 bytes in TraceRoute, but it can be increased by specifying a packet size in bytes after the destination hostname when issuing Traceroute command from the terminal.
If we use another Linux tool called My Trace Route also known as in short as MTR, we can display packet loss at every hop the packets are traveling to.
Traceroute traffic can be blocked by certain gateways or firewall IDS software or by the TTL of the reply packet as it could get mismatched to the probe’s remaining TTL. This would cause the packet response to never be returned to the sender.
When routers first connect with networks they use a Protocol called IP the Internet Protocol (IP) and OSPF (Open Shortest Path First). OSPF is a routing protocol that is implemented to find the best path for packets as they pass through a set of connected networks and intermediates.
Bear in mind that a traceroute will show you how many layer 3 hops (routers) you are getting to from A to B. But in reality, it could possibly be going through hundreds of switches in between. When traffic is traveling it could also be going through 10 of the ISP routers running on a VPN or behind transparent firewalls. However, this can be deceiving as it will often only be displayed as a single hop. Traditional VPNs are characterized by a point-to-point topology. This is one of the simplest topology methods – they are a permanent link between two endpoints. They often do not support broadcast domains (particularly when a TUN configuration is used), so services such as Microsoft Windows NetBIOS may not be fully supported or work as they would on a local area network (LAN). Designers have developed VPN variants, such as Virtual Private LAN Service (VPLS), and layer-2 tunneling protocols (such as TAP), to overcome this limitation. Multiprotocol Label Switching (MPLS) is a type of data-carrying technique for high-performance telecommunications networks. This protocol could hide its internals or show its internals back to you also. Also, keep mind that there could also be transparent firewalls along the traffic’s path. You can never truly guarantee that every single response in the path will count as a hop. It can be very deceiving at times because you could be going through any number of devices but it could show in Traceroute results lower than it actually is. For example, it could show in results 10 hops when really it could have taken even more. This is a problem for sure. But in simpler networks such as a home network and/or internet routers without fancy IDS or firewalls, it could actually be the right amount. It’s just that sysadmins can configure their appliances to skew traceroute results.
In Traceroute, you can also configure the number of queries per hop.
The command below would set the number of queries per hop to 10. Change this number for lower and higher hop queries.
traceroute hackingvision.com -q 10
Traceroute on Switches and Layer 2 devices
Cisco has a utility that works on Layer 2. But this utility is dependent on CDP protocol which :
Cisco Discovery Protocol (CDP) must be enabled on all the devices in the network. For the Layer 2 traceroute utility to function properly, do not disable CDP. If any devices in the Layer 2 path are transparent to CDP, the Layer 2 traceroute utility cannot identify these devices on the path.
How to use Traceroute
Linux
To use Traceroute in Linux open up a new command terminal and enter the following commands replacing hackingvision.com with the domain or IP address you will be using.
traceroute hackingvision.com
traceroute 192.168.1.1
More options
traceroute [options] host [packetsize] [Options: -d -f n -F -g addr -i interface -I -m max_ttl -n -p port -q n -r -s src_addr -t tos -v -w wait -x -z msecs]
Using -n option will disregard resolving hostnames and can yield much faster results in some cases.
traceroute -n host [packetsize]
If you enjoyed this article please consider sharing it on social media and with your friends, and thanks for supporting HackingVision.
Edited on 05-04-2018 3:38 by Condor.